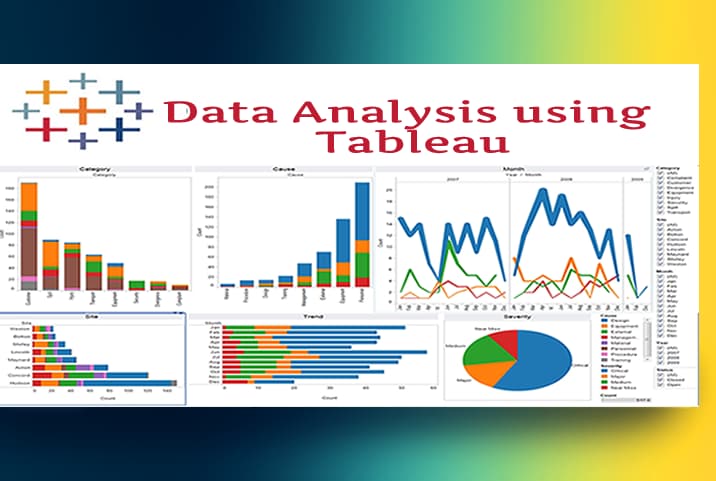
Tableau for Data analysis & visualization training in Abuja Nigeria
This Tableau for data analysis and visualization training in Abuja Nigeria is practical hands-on training that will help you understand how to go from numbers to information.
The knowledge of Tableau for Data analysis and visualization is essential for every beginner and professional with a career based on data analysis.
Our training on data analysis and Visualization using Tableau in Data School Abuja will help you understand how to work with time-series data and understand granularity.
Since Big Data is Big business, this data analysis, and Visualization Using Tableau Training in Data School Abuja will show you how to connect to varied formats of data sources like XLS, CSV, JSON and more. It takes you from basic to expert level in data analysis.
Our Tableau training begins with Tableau basics. You will learn how to navigate the software, connect it to a data file, and export a worksheet, so someone who has not used tableau before will feel completely at ease with the training.
In the data visualization section, you’ll cover how to create various charts, maps, scatterplots, and interactive dashboards for each of your projects.
It will also help you see the big picture, use Data blending in diagrams, understand all types of data joins and how to use maps and pie charts, and more.
Benefits of enrolling in our Tableau for Data Analysis And Visualization training in Abuja Nigeria?
Looking For A Data School To Learn Practical Data Analysis And Visualization Using Tableau? Then you have come to the right data school.
Are you looking for the best school to learn Tableau for data analysis and visualization in Abuja Nigeria? Our Data School Abuja Nigeria is where you will get practical Hands-On Training, a trainer will be assigned to you from the beginning to the end, it is not a crowded classroom. Our project-based learning helps you build real projects before you graduate.
Data analysis is very fast with Tableau and the visualizations created are in the form of dashboards and worksheets.
The data that is created using Tableau can be understood by professionals at any level in an organization. It even allows a non-technical user to create a customized dashboard.
Are you looking to find a way to increase your salary and enjoy your work more? Why not turn to Tableau?
Registering for this Tableau Training in Abuja can be the first step to achieving this goal. Tableau is not only great fun, it can be really lucrative.
It is the best way to change or transform the raw set of data into an easily understandable format with zero technical skills and coding knowledge.
This is a great thing about Tableau software.It doesn’t require any technical or any kind of programming skills to operate. The tool has garnered interest among people from all sectors such as business, researchers, different industries.
What you will learn in this data analysis and data visualization using Tableau.
Learn data visualization through Tableau and create opportunities for you or key decision-makers to discover data patterns such as customer purchase behavior, sales trends, or production bottlenecks.
You’ll learn all of the features in Tableau that allow you to explore, experiment with, fix, prepare, and present data easily, quickly, and beautifully.
Get a step-by-step walk-through of the fundamentals of data visualization and data discovery with Tableau. You’ll learn how to:
- Sort, filter, and group your data
- Create tables, bar charts, line charts
- Show location using geographic maps
- Aggregate with sum, average, min, max, and counts
- Create new fields using calculations
- Combine data using joins, blends, and unions
- Understand Types of Joins and how they work
- Work with Data Blending in Tableau
- Create Table Calculations
- Work with Parameters
- Create Dual Axis Charts
- Create Calculated Fields
- Create Calculated Fields in a Blend
- Export Results from Tableau into Powerpoint, Word, and other software
- Work with Timeseries Data (two methods)
- Creating Data Extracts in Tableau
- Understand Aggregation, Granularity, and Level of Detail
- Adding Filters and Quick Filters
- Create Data Hierarchies
- Adding Actions to Dashboards (filters & highlighting)
- Assigning Geographical Roles to Data Elements
- Create Sets via Formulas
- Create highly interactive Dashboards
- Perform Data Mining in Tableau
- Create powerful storylines for presentation to Executives
- Convert Raw Data Into Compelling Data Visualizations Using Tableau
Tableau for Data analysis & visualization Training Delivery Methods
Physical class training
Join our physical instructor-led interactive, and practical hands-on training in our training centers in Nigeria.

Live online training
learn from the comfort of your home or offices with our Virtual Instructor-Led live online, interactive, and practical hands-on training


